Molboolean™: Simultaneous In Situ Detection of Free & Interacting Proteins


Molboolean™ is a spatial biology technology that enables the simultaneous detection and quantification of free proteins (unbound) and interacting protein complexes in fixed cells and tissue.
Unlike traditional Proximity Ligation Assays (PLA), which only detect interactions, Molboolean utilizes a proprietary Rolling Circle Amplification (RCA) method to visualize the complete protein status (Protein A, Protein B, and Complex AB) in a single experiment.
Researchers using standard Proximity Ligation Assays (PLA) face a common limitation: PLA signals only tell you where an interaction is occurring. It leaves you blind to the non-interacting pool of proteins. However, without seeing the free protein, you cannot determine if a change in interaction signal is due to True Biological Regulation (complex dissociation) or Protein Downregulation (absence of target).
MolBoolean was designed to close that gap. Instead of reporting only where proteins interact, it simultaneously detects the free and the non-interacting proteins alongside the complex itself giving you the full picture in a single assay, and letting you see the true biological picture.
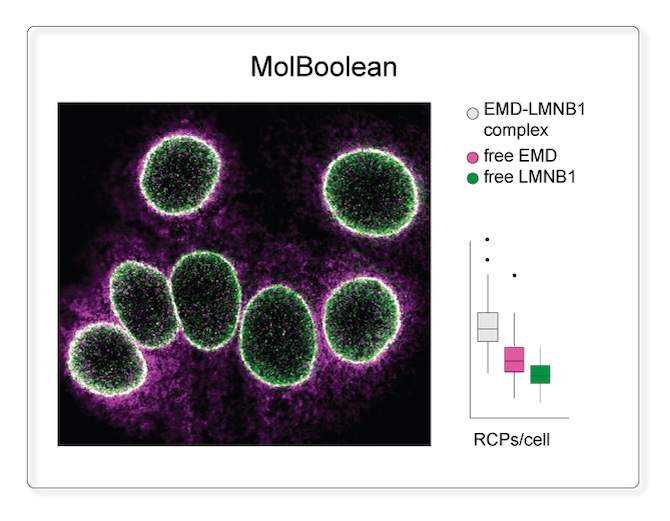
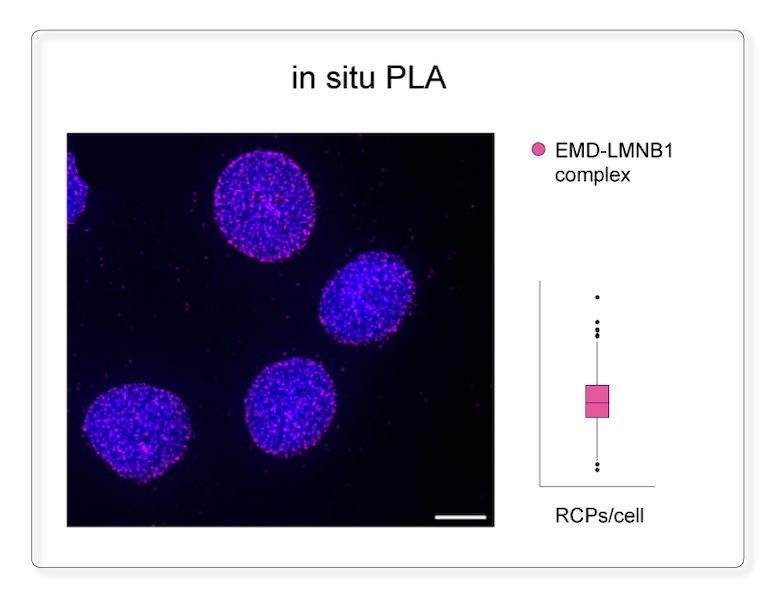
Figure 1: Molboolean vs PLA: comparative detection of EMD, LMNB1, and their complex in MCF7 cells.
Left panel: MolBoolean staining enables concurrent detection of free EMD, free LMNB1, and the EMD–LMNB1 proteins complex, providing multiplexed molecular interaction data within individual cells. This approach distinguishes between unbound and interacting protein pools.
Right panel: in situ Proximity Ligation Assay (inPLA) exclusively detects the EMD–LMNB1 complex, without resolving the presence of free, non-interacting EMD or LMNB1.
MolBoolean™ is not just an improvement.
It closes a fundamental measurement gap in spatial biology.
Discover why standard methods aren't enough. Principal Scientist Mikael Malmqvist, PhD, explains how MolBoolean provides clearer, more accurate data for protein-protein interactions.
Discount code: "ATLAS20YEARS"
Valid through 2026.
Use code at checkout on atlasantibodies.com
A universal kit that works with the customer’s choice of primary antibodies.
Designed for detection with one mouse and one rabbit primary antibody.
👉🏼 The MolBoolean Kit is available in two sizes:
MolBoolean Starter Kit – 1.6 mL (approx. 20 tissue assays or 40 cell assays)
MolBoolean Standard Kit – 4.8 mL (approx. 60 tissue assays or 120 cell assays)
The kit is customizable for most species upon request, providing flexibility for diverse research applications.
Human Kidney: ACE2 & TMPRSS2
MolBoolean™ analysis of the interaction (white) between ACE2 (magenta) and TMPRSS2 (green) in human kidney. Using anti-ACE2 (Cat. AMAb91259) and anti-TMPRSS2 (Cat. HPA035787) antibodies, the image displays the relative quantification of free versus interacting protein fractions. Results show 51% free ACE2, 17% free TMPRSS2, and 32% ACE2/TMPRSS2 complex, normalized to total target protein levels (total RCPs).
MCF7 Cells: E-Cadherin & β-Catenin
MolBoolean™ analysis of the interaction (white) between E-cadherin (cat. AMAb90862, magenta) and β-catenin (cat. HPA029159, green) in MCF7 cells, showing the relative quantification of free versus interacting protein fractions, indicated by the detection of rolling circle products (RCPs) in either one or two fluorescent channels: 32% free E-cadherin (magenta), 19% free β-catenin (green), 49% E-cadherin/β-catenin complex (white). Data is normalized to total target protein levels (total RCPs).
Human Colon: SATB2 & HDAC1
MolBoolean™ analysis of the interaction (white) between SATB2 (magenta) and HDAC1 (green) in human colon, using the monoclonal anti-SATB2 (Cat. AMAb90682) and the polyclonal anti-HDAC1 (Cat. HPA029693) antibodies.
Image shows the spatial location of free versus interacting protein fractions, indicated by the detection of rolling circle products (RCPs) in either one or two fluorescent channels.
MCF7 Cells: EMD & LMNB1
MolBoolean™ analysis of the interaction (white) between EMD (magenta) and LMNB1 (green) in MCF7 cells, using the monoclonal anti-EMD (Cat. AMAb90562) and the polyclonal anti- LMNB1 (Cat. HPA050524) antibodies.
Image shows the spatial location of free versus interacting protein fractions, indicated by the detection of rolling circle products (RCPs) in either one or two fluorescent channels.
How MolBoolean differs from PLA?
MolBoolean™ is a kit for in situ protein proximity analysis in tissue and cells developed by Atlas Antibodies. Unlike traditional methods, it provides spatial quantitative analysis of protein-protein interactions by the simultaneous detection of free and interacting proteins (~40 nm proximity).
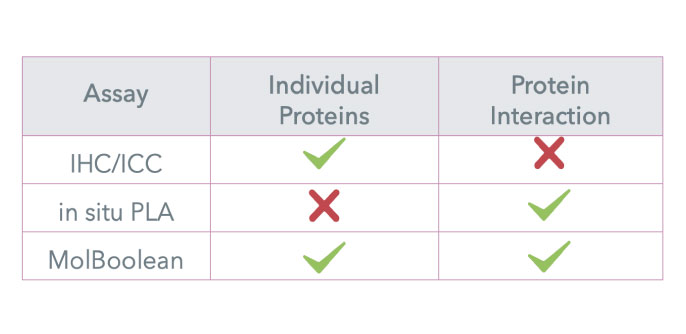
The “Molecular Boolean" Logic
The MolBoolean™ assay applies a Boolean logic at a molecular level to distinguish between free and interacting proteins, mapping protein interactions with high spatial specificity.
The OR logic identifies either protein A or B independently, signaling that they are present but not necessarily interacting.
The AND logic is applied when proteins A and B are interacting; they are detected together as complex AB, indicating a combined "true" interaction.
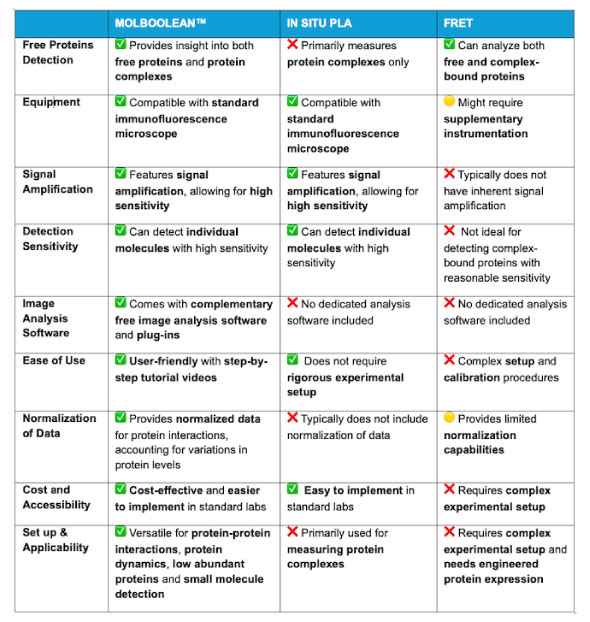
What are the benefits of using MolBoolean™ compared to traditional methods for studying protein-protein interactions?
Comparative table that highlights the advantages of MolBoolean™ over in situ PLA and FRET for studying protein-protein dynamics:
Why choose MolBoolean?
MolBoolean provides spatial quantitative analysis of protein-protein interactions by the simultaneous detection of free
and interacting proteins. MolBoolean™ offers significant benefits in fields requiring complex spatial interaction and quantification data such as:
Product Description
MolBoolean™ Mouse/Rabbit is a kit for in situ protein proximity analysis in tissue and cells. The MolBoolean™ assay utilizes a proprietary oligonucleotide setup that enables the simultaneous detection of both free and interacting (~40 nm proximity) fractions for two proteins of interest (protein A, protein B and interaction proteins AB). It uses two different immunofluorescent detection reporters with maximum emission wavelengths at 590 nm (ATTO565, TxRed filter or similar) and at 664 nm (ATTO647N, Y5 filter or similar), respectively.
MolBoolean™ Mouse/Rabbit can be performed with the user’s primary antibodies of choice (raised in mouse and rabbit). MolBoolean™ relies on anti-mouse and anti-rabbit secondary proximity probes and rolling circle amplification (RCA) as a mean to amplify signal.
A series of molecular steps, performed in the MolBoolean™ assay, incorporates information into the amplified products indicating antibody target engagement of individual versus interacting proteins. This information is converted to fluorescent signals by the binding of detection reporters, allowing visualization on a conventional fluorescent microscope. An image analysis software is provided to segment and differentiate fluorescent signals, enabling the relative quantification of free versus interacting fractions for the two analyzed protein targets in the sample.
MolBoolean Assay Steps and Workflow
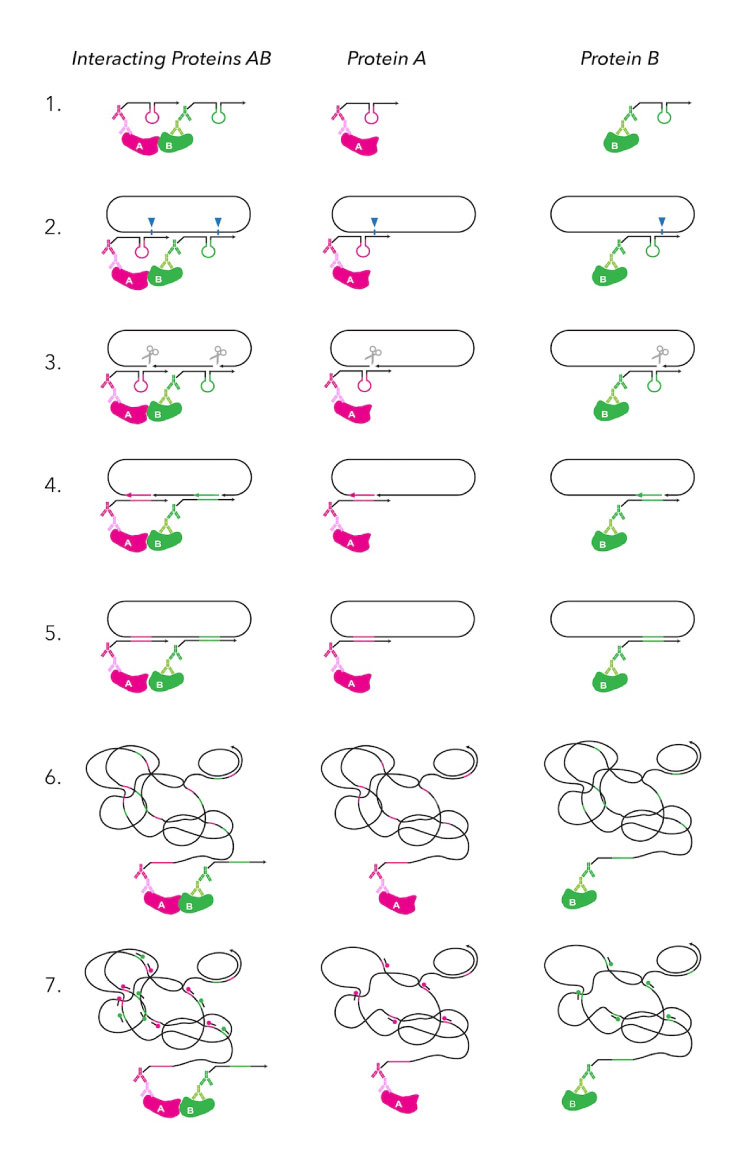
The MolBoolean™ assay follows a 2-days 7-steps workflow to determine if target proteins are interacting (AB) or present individually (A, B).
Day 1 (2 hours): blocking and primary antibodies incubation.
Day 2 (7-8 hours): probe binding, tagging, amplification, and detection.
(STEP 1) Proximity probes bind to primary antibodies attached to the proteins.
(STEP 2) Proximity probes link to the DNA circle.
(STEP 3) DNA nicking prepares the DNA for tagging.
(STEP 4) Tag oligos are added to mark the proteins.
(STEP 5) DNA ligation connects the DNA segments.
(STEP 6) Rolling circle amplification (RCA) boosts the signal for easier detection.
(STEP 7) Detection reveals both interacting and separate proteins.
What's Included in the MolBoolean Kit?
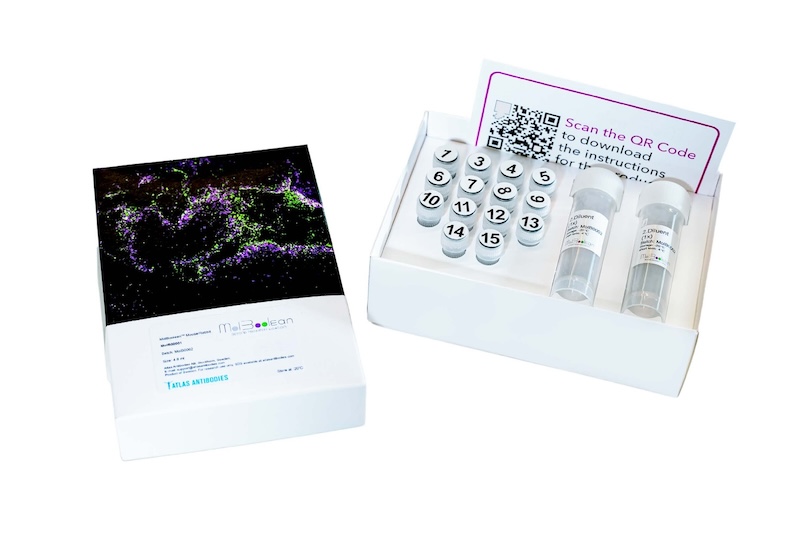
The MolBoolean™ kit includes 15 separate tubes: enzymes (nickase, ligase, polymerase), buffers, oligos for tagging and detection, secondary antibody probes and additional reagents such as blocker, and diluent.
1:Blocker (4x) - 2:Diluent (1x) - 3:Probe A (80x) - 4:Probe B (80x) - 5:Circle (40x) - 6:Additive (40x) - 7:Buffer A (10x) - 8:Nickase enzyme (80x) - 9:Buffer B (8x) - 10:Tag oligos (40x) - 11:Ligase enzyme (80x) - 12:Polymerase enzyme (40x) - 13:Buffer C (5x) - 14:Detection oligos (40x) - 15:Buffer D (10x).
The total volume of 4.8 ml, is sufficient for approx. 120 assays in cells (40 μl/assay) and 60 assays in tissue (80 μl/assay).
Can MolBoolean be used with any primary antibodies?
MolBoolean is a kit that can be used with the customer’s choice of primary antibodies (mouse /rabbit). MolBoolean is compatible with protocols already established in the lab for primary antibodies. This flexibility allows researchers to seamlessly integrate MolBoolean into their existing workflows without requiring the purchase of specialized antibodies, making it a convenient and adaptable tool for studying protein interactions and free protein levels.
Be aware that the specificity of the primary antibodies can affect the accuracy of MolBoolean results. It is important to validate the primary antibodies to ensure that they specifically target the proteins of interest before applying the MolBoolean technology. We recommend the use of Enhanced validated primary antibodies.
📖 Peer Reviewed Publications
Rivas-Santisteban R, et al, (2024) GPR88 impairs the signaling of kappa opioid receptors in a heterologous system and in primary striatal neurons. Neuropharmacology. 2024 Nov 27:110242. doi: 10.1016/j.neuropharm.2024.110242. Epub ahead of print. PMID: 39613254.
Kotliar IB, et al, (2024) Multiplexed mapping of the interactome of GPCRs with receptor activity-modifying proteins. Sci Adv. 2024 Aug 2;10(31):eado9959. Epub 2024 Jul 31. PMID: 39083597; PMCID: PMC11290489.
Malmqvist M, et al, (2024) Quantifying dopamine D2 and adenosine A2A receptor interactions in rat brain using MolBoolean™ technology. #8217 Society for Neuroscience, SfN, (2024).
Raykova D, et al, (2023) A method for Boolean analysis of protein interactions at a molecular level. Nat Commun. 2023 Sep 6;14(1):5450. doi: 10.1038/s41467-023-41325-3. Erratum for: Nat Commun. 2022 Aug 13;13(1):4755. doi: 10.1038/s41467-022-32395-w. PMID: 37673885; PMCID: PMC10482831.
Rivas-Santisteban R, et al, (2023) Boolean analysis shows a high proportion of dopamine D2 receptors interacting with adenosine A2A receptors in striatal medium spiny neurons of mouse and non-human primate models of Parkinson’s disease. Neurobiol Dis. 2023 Nov;188:106341.doi: 10.1016/j.nbd.2023.106341. Epub 2023 Oct 31. PMID: 37918757.
Gao X, et al, (2025) Molecular Boolean analyses of chemokine (C-C motif) receptor 1, α1B-adrenoceptor and arginine vasopressin receptor 1A heteromers. Biochem Biophys Rep. 2025 Dec 5;45:102404. doi: 10.1016/j.bbrep.2025.102404. PMID: 41867271; PMCID: PMC13005234.