
A new study from Uppsala University demonstrates how AtlasPlex™ multiplex IHC enables high-resolution spatial immune profiling in high-grade serous ovarian cancer (HGSOC)—mapping key tumor microenvironment cell types to reveal predictive biomarkers for treatment response.
High Grade Serous Ovarian Cancer (HGSOC) is the deadliest gynaecological cancer, responsible for the majority of ovarian cancer deaths, and one of the hardest to treat. Most patients are diagnosed at an advanced stage, and while the disease often responds to platinum-based chemotherapy at first, a large proportion of tumors eventually stop responding and relapse. Tumors also vary enormously from one patient to the next, and there is still no reliable way to predict, before treatment even starts, who will respond and who won't.
Who Will Respond to Chemotherapy?
Answering that question means looking closely at the tumor microenvironment (TME): the mix of immune cells, fibroblasts and tumor cells whose spatial arrangement can tip the balance between a tumor that responds to treatment and one that resists it.
Challenges in Mapping the Ovarian Cancer Tumor Microenvironment
The spatial detail is exactly what multiplex immunohistochemistry (mIHC) is built to capture, and it's the focus of a Master's thesis carried out by Nikoletta Drazinaki, at Uppsala University, supervised by Prof. Cecilia Lindskog, in collaboration with Atlas Antibodies.
Her project, "Refining spatial immune profiling in High Grade Serous Ovarian Cancer: Advancing multiplex imaging for precision oncology," puts AtlasPlex, the multiplexing kit developed by Atlas Antibodies, to work on real ovarian cancer tissue and uses it to start hunting for biomarkers of chemotherapy response.

"What struck me most about AtlasPlex was how the tyramide amplification let us pick up markers we'd otherwise struggle to see clearly, even at lower abundance in the tissue. And because it works directly with primary antibodies, there's no secondary detection chain to build and validate every time you want to test a new marker — which made it much easier to expand and adapt our panel as the project evolved."
— Nikoletta Drazinaki, Applied Biotechnology Master's student, Uppsala University
Simplifying Multiplex Immunohistochemistry with AtlasPlex™
Conventional immunohistochemistry (IHC) can only show one protein at a time. That's a real limitation when the question isn't "is this protein present?" but "which cells are present, where are they relative to the tumor, and which of them are interacting with each other?"
AtlasPlex, the new multiplexing kit from Atlas Antibodies, Sweden, is built around a simpler way to get there.
Multiplex IHC answers that by staining several targets in the same tissue section, one at a time, each tagged with a different fluorophore, so that in the end a single image shows tumor cells, fibroblasts, macrophages, B cells and T cells all at once, each in their own color, in their true spatial position.
Instead of the traditional two-step detection where a primary antibody is followed by a secondary antibody carrying the enzyme, AtlasPlex uses primary antibodies that are pre-biotinylated.
In each staining cycle, that biotinylated antibody is incubated with StreptaClick®-HRP, generating an HRP-conjugated primary antibody on the spot. From there, tyramide signal amplification (TSA) proceeds as normal, depositing a bright, stable fluorescent signal right at the target site, and any leftover HRP activity is quenched before the next cycle begins. Removing the secondary antibody step also removes the harsh heat-inactivation step that normally comes with it, so the tissue goes through fewer boiling cycles over the course of a multiplex panel.
AtlasPlex: Custom Multiplex IHC
Validated 5-Plex Immune Panel for HGSOC Biology
For this project, Drazinaki assembled a 5-plex immune panel tailored to HGSOC biology:
- KRT7 for tumor epithelial cells (Atlas Antibodies Cat. HPA007272)
- CD163 for macrophages (Atlas Antibodies Cat. HPA046404)
- CD79A for B cells (Atlas Antibodies Cat. HPA056444)
- CD8A for CD8+ T cells (Atlas Antibodies Cat. HPA037756)
- FBLN2 for fibroblasts (Atlas Antibodies Cat. HPA001934)
fibroblast markers in particular took real work to land on: five candidates (FBLN2, POSTN, P4HA2, GJA1, NNMT) were screened by IHC and scRNA-seq expression data before FBLN2 emerged as the most specific.
The result is a panel that reliably resolves five distinct cell populations in a single ovarian cancer tissue section with a gentler workflow than traditional secondary-antibody-based mIHC.
Because AtlasPlex uses pre-biotinylated primary antibodies and chemical HRP quenching between cycles rather than heat inactivation, the tissue only goes through antigen retrieval once, at the start, and each marker is then stained in its own cycle: antibody incubation, HRP conjugation, tyramide amplification, and quenching, before moving to the next target. Even so, the order in which markers are cycled through matters, since some epitopes hold their signal better earlier or later in the sequence.
Visualizing Cellular Interactions in the Tumor Microenvironment
Each channel in the panel maps onto a specific compartment of the ovarian tumor microenvironment.
KRT7 (yellow) marks the tumor epithelium, tracing the malignant glandular structures that run through the core. FBLN2 (red) marks the surrounding fibroblast-rich stroma, the connective tissue that supports the tumor and, when activated into cancer-associated fibroblasts, can promote tumor growth and invasion. Layered into both compartments are the immune populations: CD163 (cyan) marks macrophages, often the most abundant infiltrating immune cell in HGSOC and a population linked to poorer outcomes when skewed toward the immunosuppressive M2 phenotype; CD8A (green) marks cytotoxic CD8+ T cells, generally considered a positive prognostic signal when found infiltrating the tumor; and CD79A (white) marks B cells, present at lower density but implicated in shaping the local immune response.
Recombined, the full panel turns those five separate stains into one coherent map of the tissue, letting a researcher trace, cell by cell, whether an immune cell sits inside the tumor nests or is held back in the stroma the kind of spatial detail that single-marker IHC simply can't provide.
Figures 1 and 2 show representative AtlasPlex stainings of two ovarian cancer tissue cores, each imaged with the full 5-plex HGSOC panel described above.
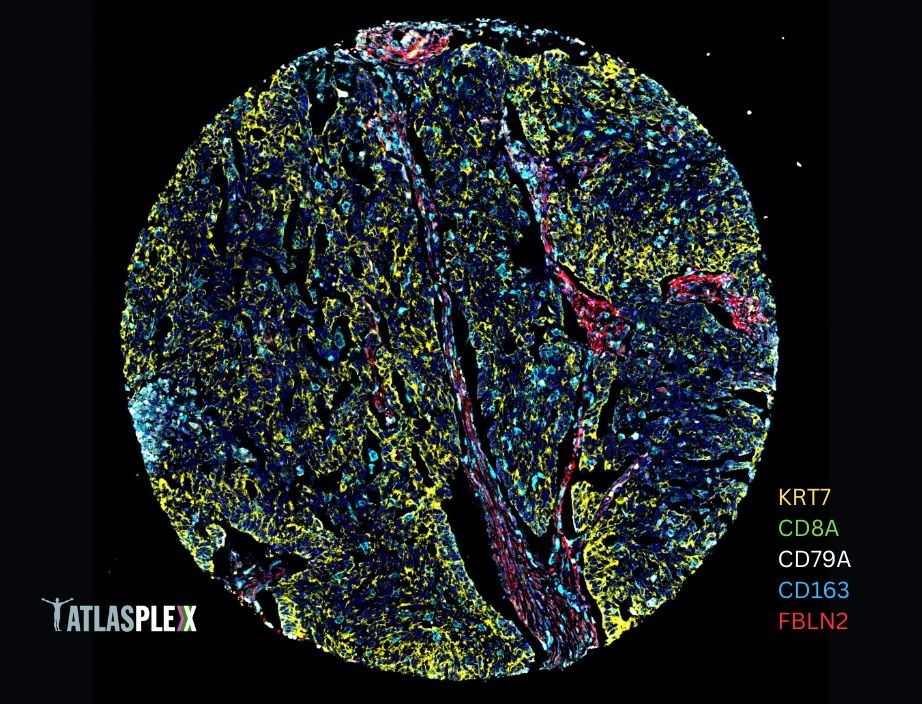
Figure 1: 5-plex HGSOC Immune Panel with AtlasPlex (example 1). Representative multiplex IHC staining of the 5-plex HGSOC immune panel using the AtlasPlex kit on ovarian cancer tissue. Yellow: tumor epithelial cells (KRT7, HPA007272, 1:696, Tyramide CF430). Red: fibroblasts (FBLN2, HPA001934, 1:223, Tyramide 555). Cyan: macrophages (CD163, HPA046404, 1:1000, Tyramide 647). White: B cells (CD79A, HPA056444, 1:909, Tyramide 594). Green: CD8+ T cells (CD8A, HPA037756, 1:160, Tyramide 488). Blue: nuclei (DAPI).
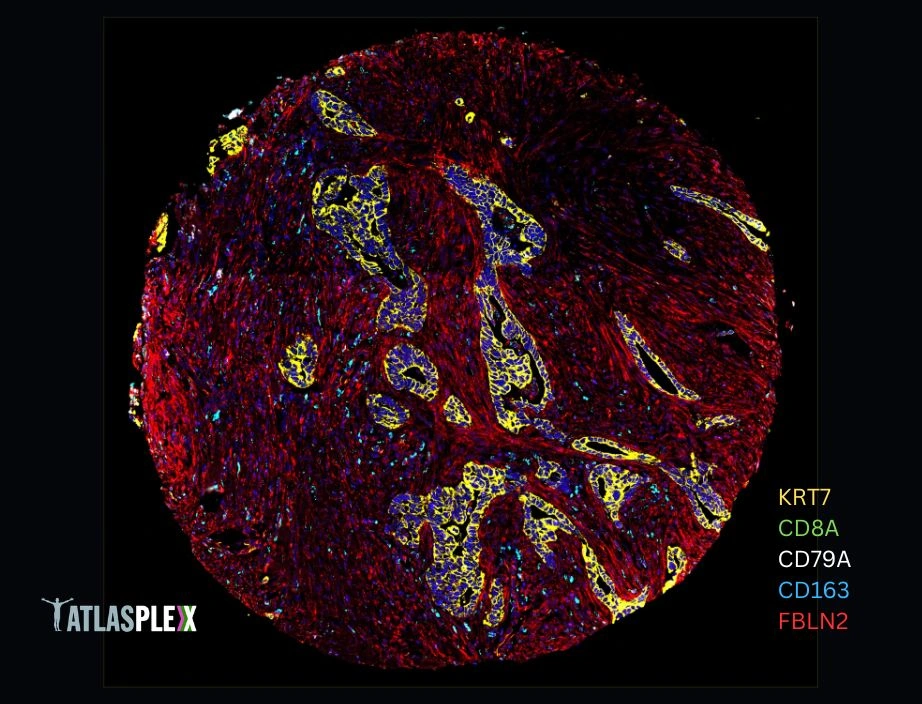
Figure 2: 5-plex HGSOC Immune Panel with AtlasPlex (example 2). Representative multiplex IHC staining of the 5-plex HGSOC immune panel using the AtlasPlex kit on ovarian cancer tissue. The image shows the full panel; individual channels are: Green: CD8+ T cells (CD8A, HPA037756, 1:160, Tyramide 488). White: B cells (CD79A, HPA056444, 1:909, Tyramide 594). Cyan: macrophages (CD163, HPA046404, 1:1000, Tyramide 647). Red: fibroblasts (FBLN2, HPA001934, 1:223, Tyramide 555). Yellow: tumor epithelial cells (KRT7, HPA007272, 1:696, Tyramide CF430).
Scaling Multiplex Imaging: From 5-Plex to 8-Plex Panels
Because AtlasPlex relies on primary antibodies directly, adding or swapping a marker doesn't require sourcing and validating a whole new secondary detection chain, which makes it easier to adapt a panel as new candidate biomarkers emerge.
That flexibility matters for the next phase of Drazinaki's project: an 8-plex HGSOC immune panel — adding PDGFRB (fibroblasts), PD-L1, PAN-KRT (tumor cells), and FOXP3 (regulatory T cells) to the core immune markers, with one open channel reserved for testing new candidate proteins tied to chemotherapy response.
That open channel has already turned up a promising lead. HLA-DRB1, one of several candidate markers identified through mass spectrometry comparisons of chemoresistant versus chemosensitive HGSOC tumors, showed clear co-localization with the macrophage marker CD163 when tested in the panel — matching what single-cell RNA sequencing data had predicted about which cells should express it. It's an early result, but it's the kind of validation that turns a computational hit into a real candidate.

“At the Human Protein Atlas, AtlasPlex was evaluated for multiplex immunohistochemistry in ovarian cancer tissue. The platform enabled targeted multiplex panel design for spatial profiling of the tumor microenvironment, allowing simultaneous visualization of tumor, stromal, and immune cell populations within the same tissue section. The work highlighted the importance of combining established immune markers with additional context‑specific targets, illustrating how flexible panel design can support both standardized profiling and more exploratory, biology‑driven analysis within the same experiment.”
— Prof. Cecilia Lindskog, Head of Laboratory, Department of Immunology, Genetics and Pathology, Uppsala University; Director, Human Protein Atlas Tissue Atlas
3 Takeaways
- Spatial context is the story:
AtlasPlex doesn’t just show which cells are present in HGSOC tissue; it reveals where immune cells, fibroblasts, and tumor cells sit in relation to each other. That matters because immune cells inside tumor nests may mean something very different from immune cells held back in the stroma. - A validated 5-plex panel makes the tumor microenvironment visible
The project built a tailored 5-marker panel (KRT7, CD163, CD79A, CD8A, and FBLN2) to map tumor cells, macrophages, B cells, CD8+ T cells, and fibroblasts in one tissue section. The careful selection of FBLN2 after screening five fibroblast candidates is especially important because stromal mapping depends on marker specificity. - HLA-DRB1 is an early but promising biomarker lead (next phase)
HLA-DRB1, identified through mass spectrometry comparisons of chemoresistant and chemosensitive tumors, co-localized with CD163 macrophages in the AtlasPlex panel. The key takeaway is that multiplex imaging can help move candidate biomarkers from omics data toward tissue-level validation, though cohort-scale confirmation is still needed.
Future Directions: Biomarker Discovery and Patient Stratification
The next stage of the project will apply the 8-plex panel across a full cohort of chemoresistant and chemosensitive HGSOC patients, quantifying how immune and stromal composition differs between the two groups in both the tumor and stromal compartments. If markers like HLA-DRB1 hold up at that scale, they could feed directly into better patient stratification — helping clinicians identify, before treatment even begins, which HGSOC patients are more likely to respond to standard chemotherapy and which might need a different approach.
More broadly, this work is a good illustration of what multiplex imaging is for: not just prettier pictures of tissue, but a way to ask spatial questions about disease that single-marker methods simply can't answer. As AtlasPlex panels expand and more candidate markers are validated this way, the tumor microenvironment stops being a black box and starts becoming a map; one that could eventually help guide real treatment decisions in the clinic.
AtlasPlex: See More, Discover More.